

From the Research Lab: What do Cutting-Edge Rent Indices Tell Us About the US CRE Market?
A new rent index methodology from Columbia and CompStak uses detailed lease data to track rent changes for comparable CRE space across locations and over time, avoiding the composition biases that distort traditional measures.
by Stijn Van Nieuwerburgh, Earle W. Kazis and Benjamin Schore Professor of Real Estate, Finance Division, and Wayne Yu, SVP of Data, CompStak
March 2026
A good financial index should capture the pulse of a market in a single, meaningful statistic. For US commercial real estate (CRE), we have never quite had that for rents. Existing measures either cover only a narrow slice of properties or rely on methods that blend very different kinds of buildings and locations without accounting for their differences. As a result, much of the conversation about “rent growth” has been built on shaky ground. However, recent work by researchers at Columbia Business School and CompStak has resulted in a new rent index that is both broad in coverage and careful about bias: the Columbia CompStak Rent Index (CCRI). Built from roughly a million detailed lease transactions across office, retail, and industrial space, the CCRI is available across 130 cities and MSAs, starting from 2010, and updated monthly at the national level and quarterly for individual markets. The data includes information on the rent, the size of the space, the length and structure of the lease, building characteristics, and precise location. This allows us to do something earlier indices could not: track rents across property types, at high frequency and fine geographic detail, while holding the quality of the underlying space constant.
Instead of asking, “What is the average rent among leases signed this quarter?”, the index asks, “How have rents changed over time for similar space in similar locations?” In practice, that means two things. First, the index is based on net effective rent per square foot, not just the headline starting rent. Net effective rent (NER) includes concessions like free months and tenant improvement allowances, so it reflects the true underlying economics. Second, the model anchors each lease in a hierarchy of places. When there are enough observations for a particular building, the index compares the building to itself over time. Where data are thinner, leases are grouped at the level of a very small neighborhood, and if needed, broader units like Census tracts, counties, metros, and states. At each level, the model controls for stable features of the location and building, then uses the remaining variation over time to trace out a constant-quality rent (CQR) path. This stands in contrast to traditional raw rent statistics, which implicitly treat the sample of leases in each period as interchangeable, even when that sample shifts toward higher- or lower-quality assets in different periods.
The difference between these approaches becomes clear when we look at the recent history of office rents. For example, Deloitte and Sidley Austin’s decision to lease 8 floors of 23Springs on Dallas’ Cedar Springs Road in 2024Q1 was widely read as proof that its office market was “back,” but constant‑quality indices show that this sort of high-profile flight-to-quality transaction can coincide with stagnant or falling rents in the rest of the market. Once you hold building quality and location constant, the apparent growth in Dallas office rents shrinks dramatically. What looks like a solid recovery in the raw numbers becomes a near-stall in the quality-adjusted series. The gap between the two is not a rounding error; it is large enough that they imply opposite narratives—one of robust recovery, the other of lingering weakness.
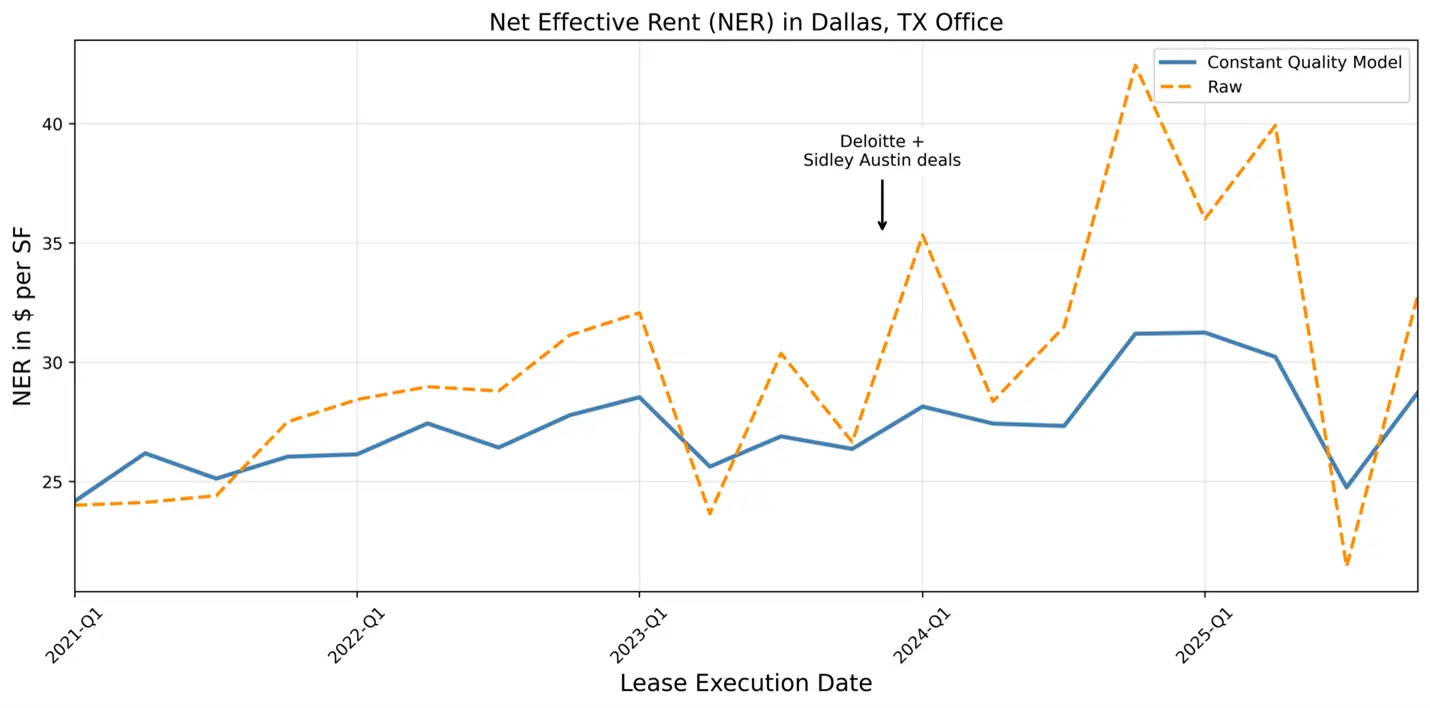
Why such a big difference? During periods of stress, leasing activity tends to concentrate in the safest and most desirable buildings. After COVID, many tenants downsized but upgraded: they left older, peripheral buildings and signed leases in newer, better-located ones. If you simply average the rents you observe, those upgrades push the average up, even if landlords in less favored buildings are cutting prices or sweetening terms. Traditional metrics cannot distinguish between “rents are rising everywhere” and “more of the activity is happening in top-tier buildings.” The CCRI can, because it compares like with like.
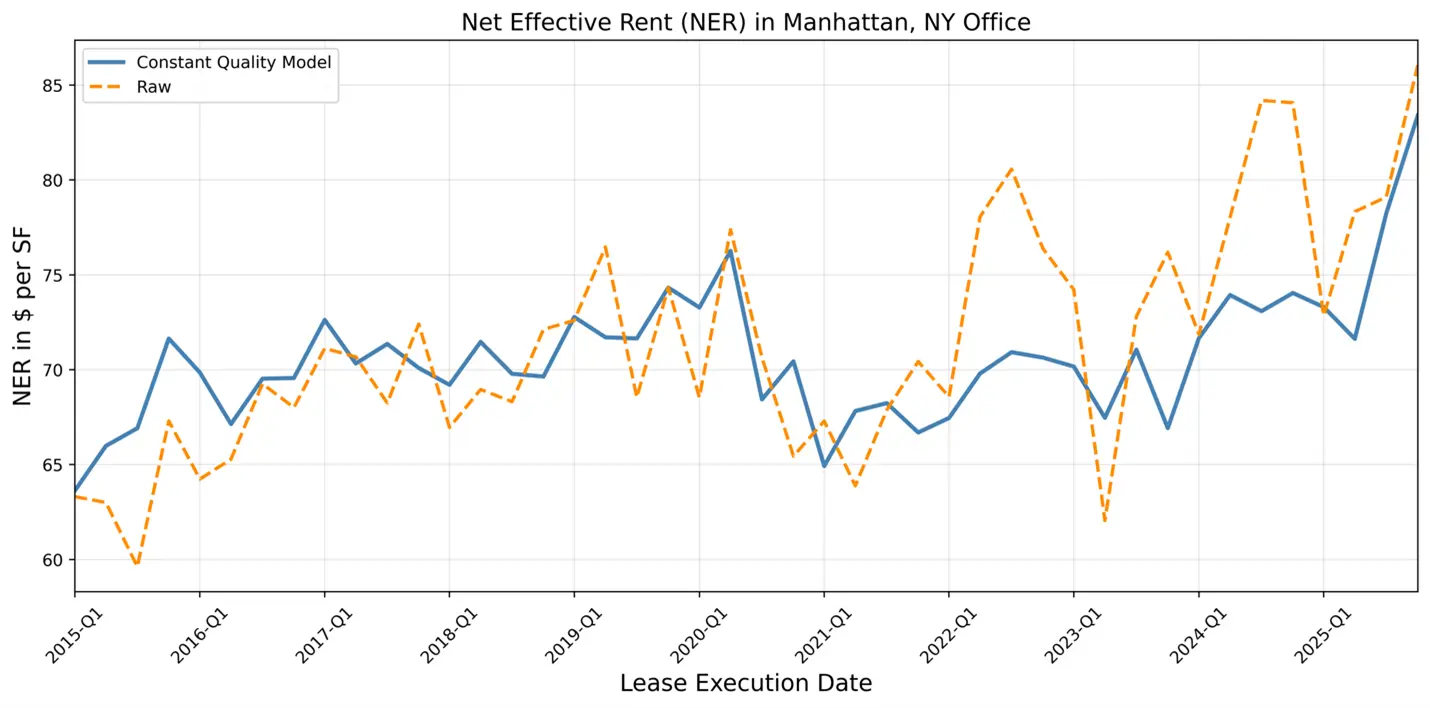
Similarly, in Manhattan, quality-adjusted office rents fell sharply during the pandemic and by mid-2025 had only just crawled back to where they started. The headline deals are real, but they are happening against a backdrop of many buildings still struggling to fill space. The tide really began to turn for Manhattan office leasing in the second half of 2025, with a large 16.3% increase in NER from $71.6 in 2025.Q2 to $83.3 per square foot in 2025.Q4, quality adjusted.
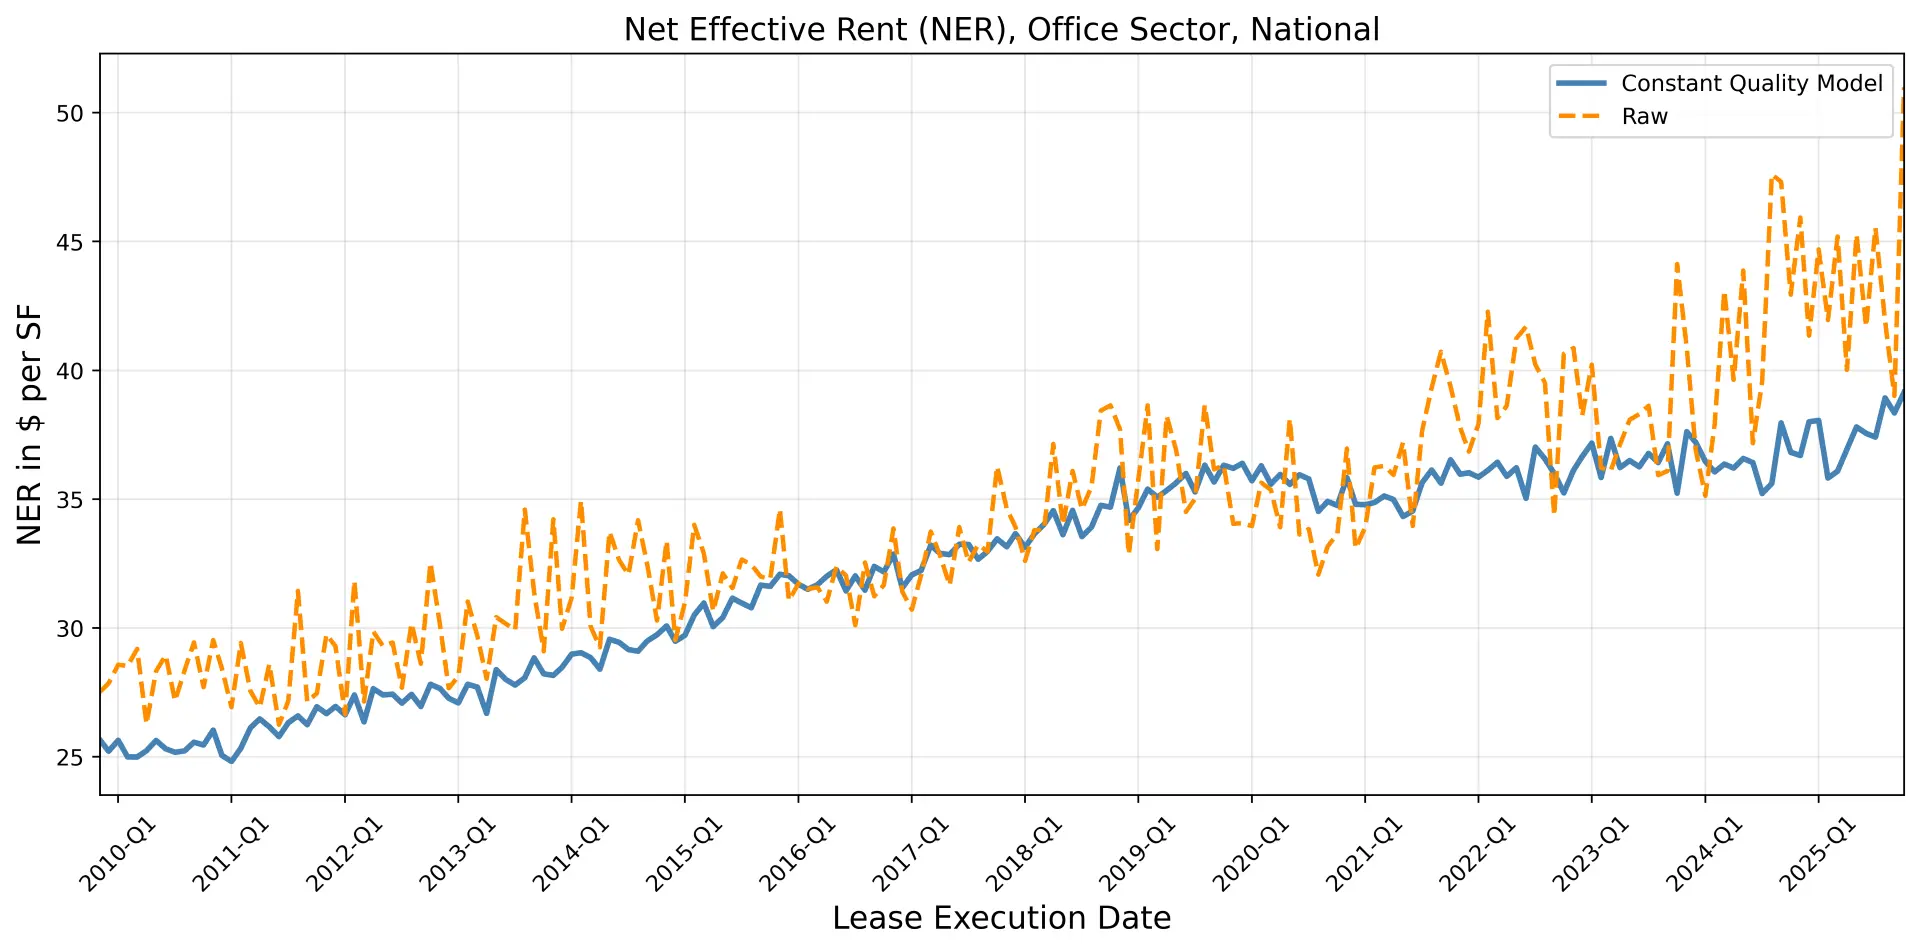
Zooming out to the national office index, these patterns (along with others) manifest in a very different conclusion, highlighting a crucial point for policymakers: there is no single “office market.” What looks like a gentle national recovery in an aggregate series is, in fact, a patchwork of different local stories. A mayor in San Francisco, facing sustained declines in quality-adjusted office rents, has a very different fiscal and planning challenge than a mayor in Manhattan, where rents have recovered better. Our index naturally smooths monthly fluctuations in raw rents, not by constructing trailing averages, but because it holds fixed the underlying quality of the property. After making little progress for over five years, office rents in America are on the mend at the end of 2025.
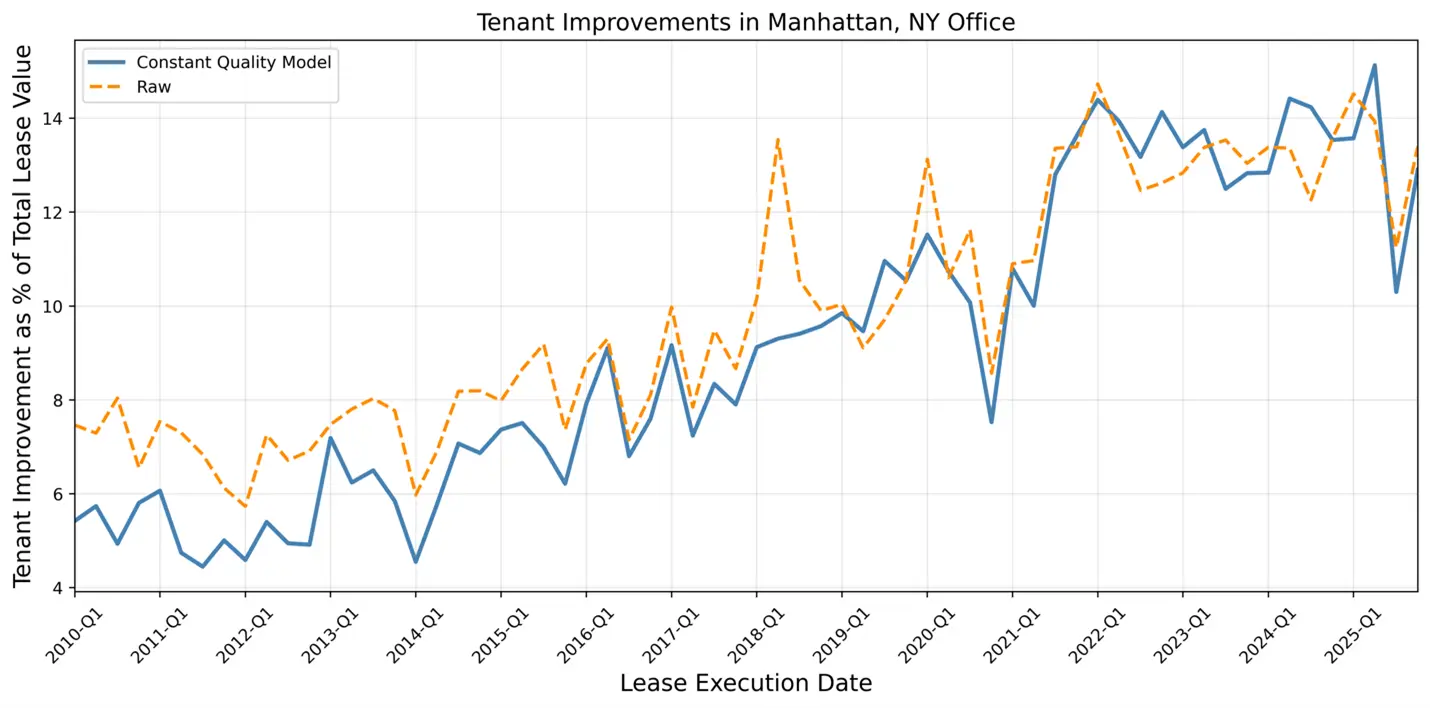
The constant-quality lens also reveals how much of the adjustment in office markets has come not through visible cuts in face rents but through less visible concessions. In Manhattan, for example, the share of total lease value devoted to tenant improvements, money landlords give tenants to build out their space, roughly doubled over the decade before COVID and has remained high. Free rent periods also expanded, from just a few percent of the lease term to close to a tenth in many cases and have stayed elevated. A ten-year lease that includes two years of free rent and a generous build-out allowance is effectively deeply discounted relative to the headline rent. Because traditional statistics tend to focus on starting rents, they miss much of this give-back. The CQR framework, by working with net effective rent and constructing separate indices for quality-adjusted concessions, makes those adjustments visible.
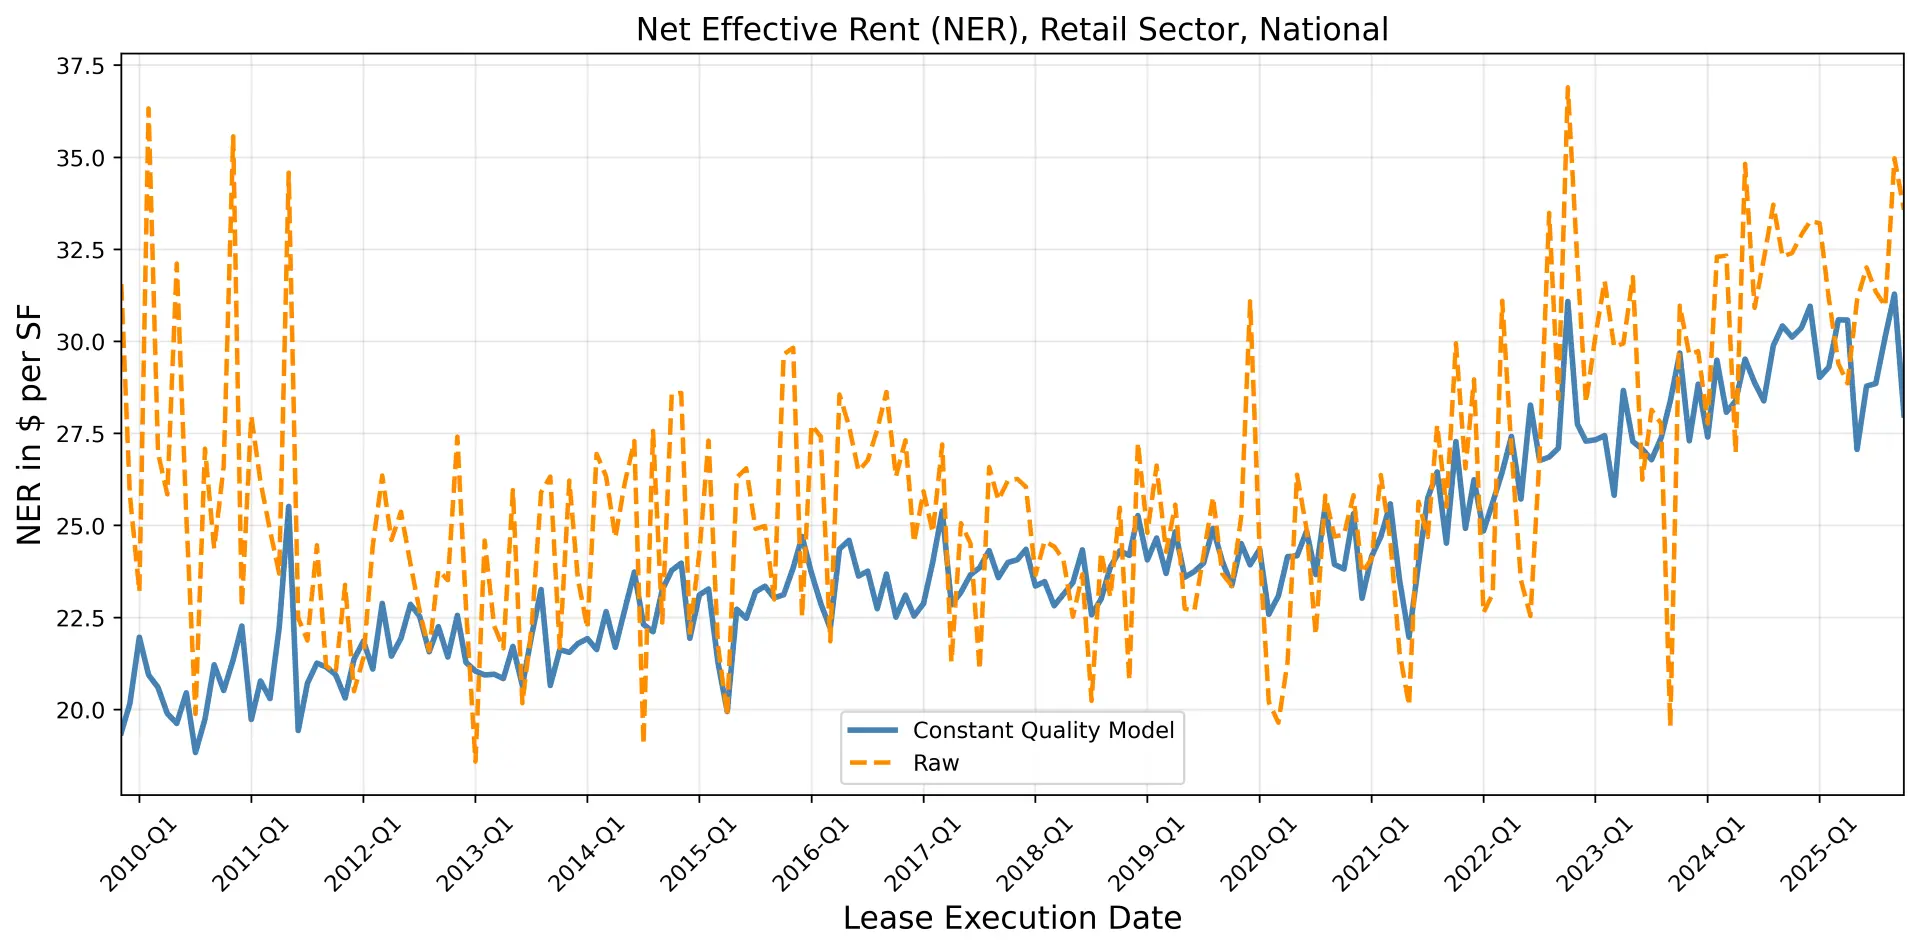
We also construct constant-quality rent indices for retail and industrial CRE sectors. Over the last 15 years, brick-and-mortar retail has faced relentless pressure from e‑commerce and changing consumer behavior. The constant-quality retail index reflects this reality: once you hold quality and location fixed, retail rent growth has been muted, without a strong upward trend. Raw retail rents, by contrast, are highly volatile. They jump when a big flagship lease in a premier shopping district hits the tape, then sag when the bulk of observed deals shift back to smaller or secondary centers. This volatility can tempt observers to declare “the return of the store” on the back of a few spectacular leases. The constant-quality series acts as a corrective, showing that beyond the glare of high-street headlines, typical retail space has not seen a dramatic renaissance.
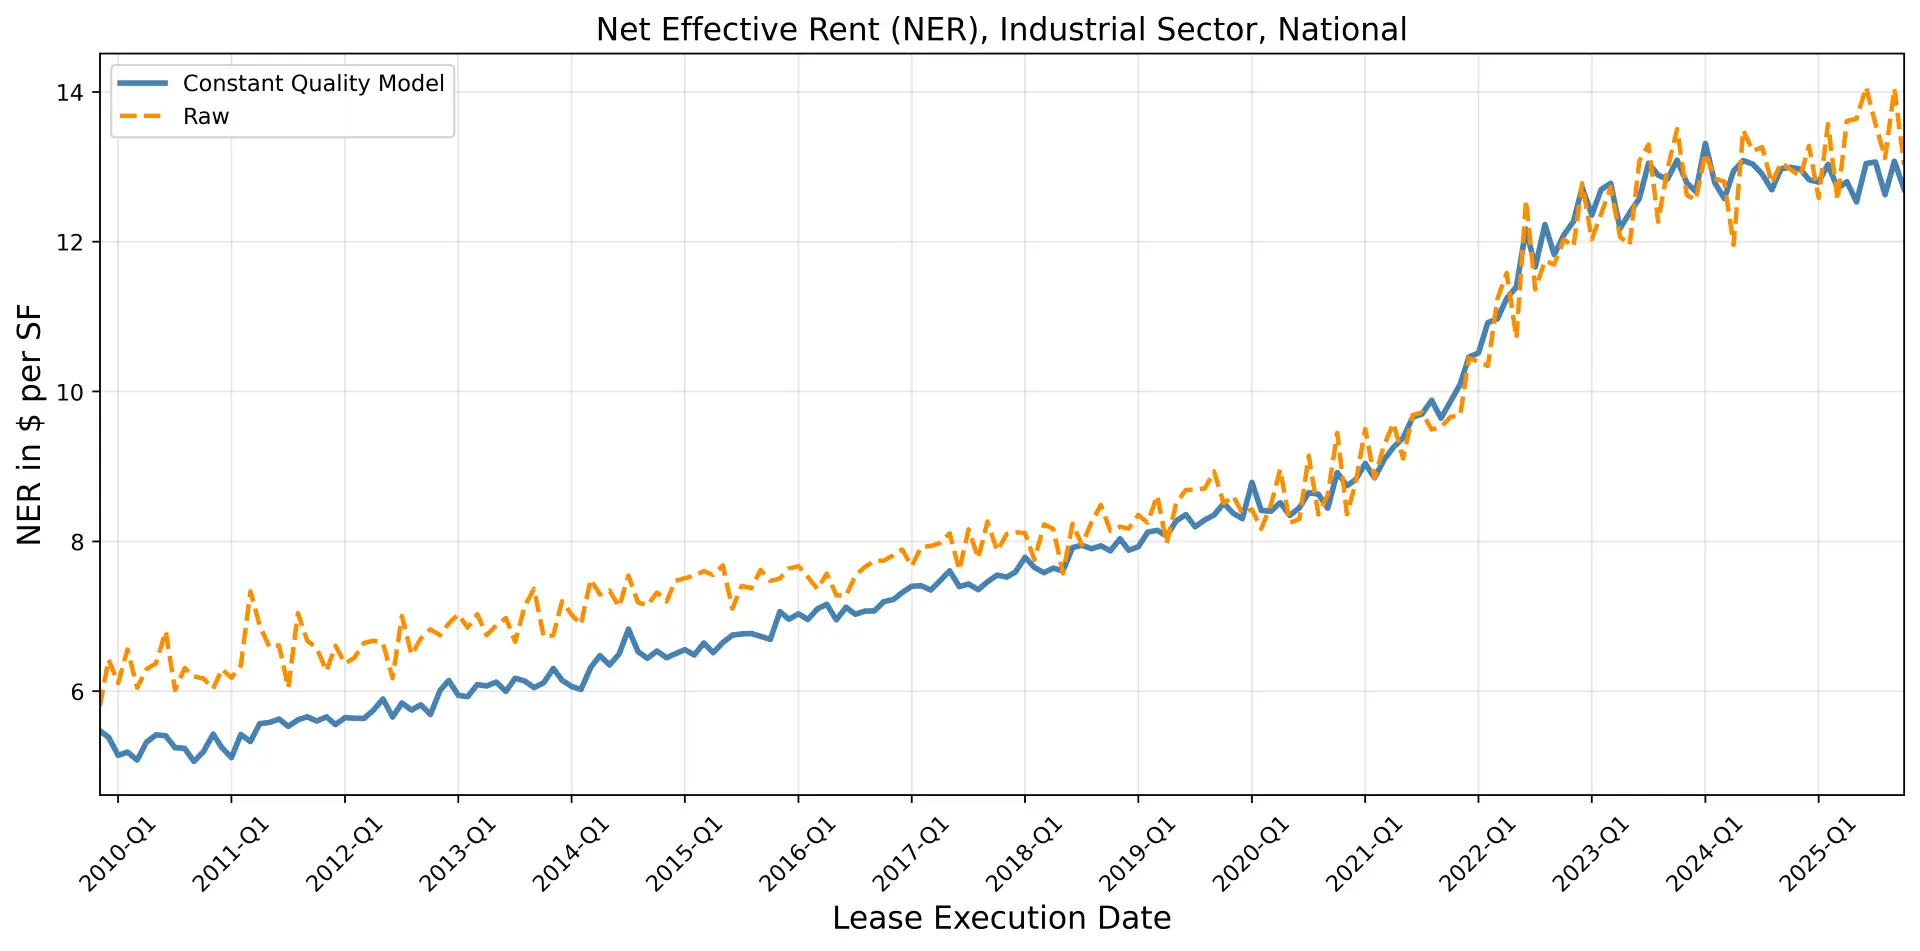
Industrial is the useful foil. In that sector, warehouses, logistics hubs, and distribution centers are more standardized than offices or retail spaces. The pandemic accelerated demand for logistics space, as households and businesses leaned heavily into online ordering and just‑in‑time delivery. Here, the raw rent measures and the constant-quality index tell broadly the same story: a genuine, broad-based boom, with rents rising sharply across the country. A rising tide lifts all boats. Because the surge was so widespread, composition effects are modest. Rising interest rates and substantial new supply slowed down the rent growth by 2024. It is conceivable that as some markets like the Inland Empire’s industrial markets see further weakness in rents, quality dynamics will play an increasingly important role.
These findings have direct consequences for how different participants in the CRE ecosystem should interpret the market. For lenders and buyers of commercial mortgage-backed securities, the message is that if you underwrite loans on the basis of raw rent statistics that are flattered by flight-to-quality transactions and masked by concessions, you are likely to overestimate the strength of the collateral. The constant-quality office indices suggest that in many markets, especially for non-prime buildings, true rent fundamentals are weaker than the simple averages imply. That translates into thinner cushions for debt service and higher vulnerability to shocks.
For local policymakers, the divergence between raw and quality-adjusted rent paths complicates planning. Property taxes are a major revenue source for cities, and those taxes are ultimately tied to income-generating capacity. If city governments assume that office rents have recovered because raw averages have drifted up, their re-assessments may hit weaker properties particularly hard and even cause financial distress due to excessive taxation. Having a clearer picture of constant-quality rents by neighborhood and property type helps align taxation with economic reality.
For tenants, the picture is more encouraging. Once concessions and quiet discounting are considered, net effective rents are often substantially lower than the headline rents suggest, especially in office markets with persistent slack. The constant-quality indices show that, in many places, landlords are still under pressure, even if trophy leases create an impression of strength. That means tenants who are prepared to negotiate on term length, tenant improvements, and flexibility may have more leverage than they realize.
Stepping back, the broader lesson is about how we measure a market that is, by nature, opaque. CRE rents are set in bilateral negotiations, recorded in private documents, and reported with delays. When we compress this messy reality into a single number, the way we do it matters enormously. Indices built on raw averages mix together two stories: changes in the underlying demand and supply for space, and changes in which types of buildings are transacting. The Columbia CompStak Rent Index is an attempt to disentangle those stories by holding building and location quality constant. Powered by over a million lease data points, contributed by commercial real estate professionals, it offers the clearest view to date of the true market evolution.
For anyone making decisions about commercial real estate--whether allocating capital, setting policy, or signing a lease--seeing the market as it really is, rather than as the averages make it appear, is the essential first step toward getting those decisions right.
References
- Abramson, Boaz, Gaurav Choudhary, Joel Joonyoung Kim, Tomasz Piskorski, Ziyi Qiu, Stijn Van Nieuwerburgh, and Wayne Yu. “The Columbia-CompStak Quality-Adjusted Commercial Real Estate Rent Index,” Working Paper, 2025.
- Gupta, Arpit, Vrinda Mittal, and Stijn Van Nieuwerburgh. “Work from Home and the Office Real Estate Apocalypse,” American Economic Review, 2026.
- Koijen, Ralph, Neel Shah, and Stijn Van Nieuwerburgh. “The Commercial Real Estate Ecosystem,” Working Paper, 2025.
About the Contributors:
 Stijn Van Nieuwerburgh is the Earle W. Kazis and Benjamin Schore Professor of Real Estate and Professor of Finance at Columbia University’s Graduate School of Business, which he joined in July 2018 after 15 years at New York University’s Stern School of Business. He earned his PhD in Economics (2003), MSc in Financial Mathematics (2001), and MA in Economics (2001) from Stanford University, and a B.A. in Economics from the University of Ghent, Belgium (1998).
His research lies in the intersection of real estate, asset pricing, and macroeconomics. He studies the impact of remote work on real estate valuations, affordable housing policies, mortgage market design, the impact of foreign buyers on the housing market, property price dynamics, and mortgage choice. Another recent strand of his research focuses on government debt and fiscal policy. His has published over 50 articles in peer-reviewed journals and his work is frequently covered in the media, including on 60 Minutes, the New York Times, the Wall Street Journal, the Economist, and the Financial Times. Full bio here.

Wayne Yu is Senior Vice President at CompStak and has spent over a decade in Commercial Real Estate (CRE) technology and data science. Prior to CompStak, his research focused on combining geospatial interpolation with Automated Valuation Models (AVM) for tax assessment in Taiwanese local government agencies.
At CompStak, Wayne leads the integration of Machine Learning into data workflows, specifically for market rent prediction, record linkage, and entity resolution. His work centers on deploying Human-In-the-Loop processing to pave the inevitable grunt work needed for CRE analytics data engineering. Recently, Wayne has focused on using AI research agents to source and validate a CRE Knowledge Graph, connecting professional entities, parcel geometry, and financial transactions to create a holistic view of complex CRE transactions.
Wayne holds an MS in Real Estate Finance from New York University and a BA in Land Economics from National Chengchi University.