

From the Research Lab: The Commercial Real Estate Ecosystem
In public markets, the identity of the marginal buyer is usually a footnote. If one investor steps away, another one shows up, without much impact on the price. Commercial real estate (CRE) does not work that way.
by Stijn Van Nieuwerburgh, Earle W. Kazis and Benjamin Schore Professor of Real Estate, Finance Division, and Neel Shah, Ph.D. Candidate, Finance, Columbia Business School
April 2026
Buildings trade infrequently, and deals happen through networks, brokers, and targeted outreach. Since buyers do not arrive as an anonymous mass, who shows up can determine not only the clearing price, but even whether a deal takes place.
That observation is the starting point of our research approach: We treat CRE as an ecosystem of investor types, specialties, and relationships. Each investor type—REITs, REPE funds, Institutions, local and national owner operators/developers, foreign investors, and end users—faces different constraints, capabilities and tastes, which may vary over time. In our framework, a transaction price is the outcome of a match between a specific seller and a specific buyer. Valuation has to reflect not only the asset but also the investor ecosystem around it. Concretely, for any building we ask: which buyer types are likely to be interested, how would each of them value this asset, and what does that imply for the price, price risk, and liquidity.
That perspective has a direct implication: if prices are set by a match between an asset and a segmented buyer ecosystem, then value isn’t just a single number, it’s the outcome of who actually engages. Practitioners see this all the time: two buildings look nearly identical on paper, yet trade at meaningfully different cap rates; a bid can clear well above the comp set; or a deal can stall even when the ask seems reasonable. The usual explanation offered is often “noise”—a quirky buyer, odd timing, or imperfect information. Our approach treats that apparent noise as structure.
Different investor types show up to different deals and underwrite them differently: REITs and large institutions such as pension funds or sovereign wealth funds tend to concentrate in larger, more standardized transactions; REPE funds and developers price optionality and execution; local owner-operators lean into neighborhood knowledge and smaller ticket size; whereas foreign investors may target specific “trophy” properties. Since the buyer pool varies systematically across properties and over time, the right valuation object is not a point estimate, but a range. So, instead of asking, “What is the building worth?”, the more operational question is: “What is this building worth to the buyers who are likely to engage, and how wide is the distribution of plausible outcomes?”
We harness the power of big data, machine learning methods, and insights from the natural language processing literature to estimate the parameters of the model. We use 475,000 transactions of office, retail, industrial, and multifamily properties over half a million dollars that took place between 2001 and 2023 from the data provider MSCI Real Capital Analytics (RCA). The aggregate value of the deals is $10 trillion. We split the transactions into 60 geographic markets. The most remarkable aspect of this data is the work that went into identifying the true identity of the buyers and sellers of each building, unmasking obscure LLC parties. There are about 300,000 unique investors in our data.
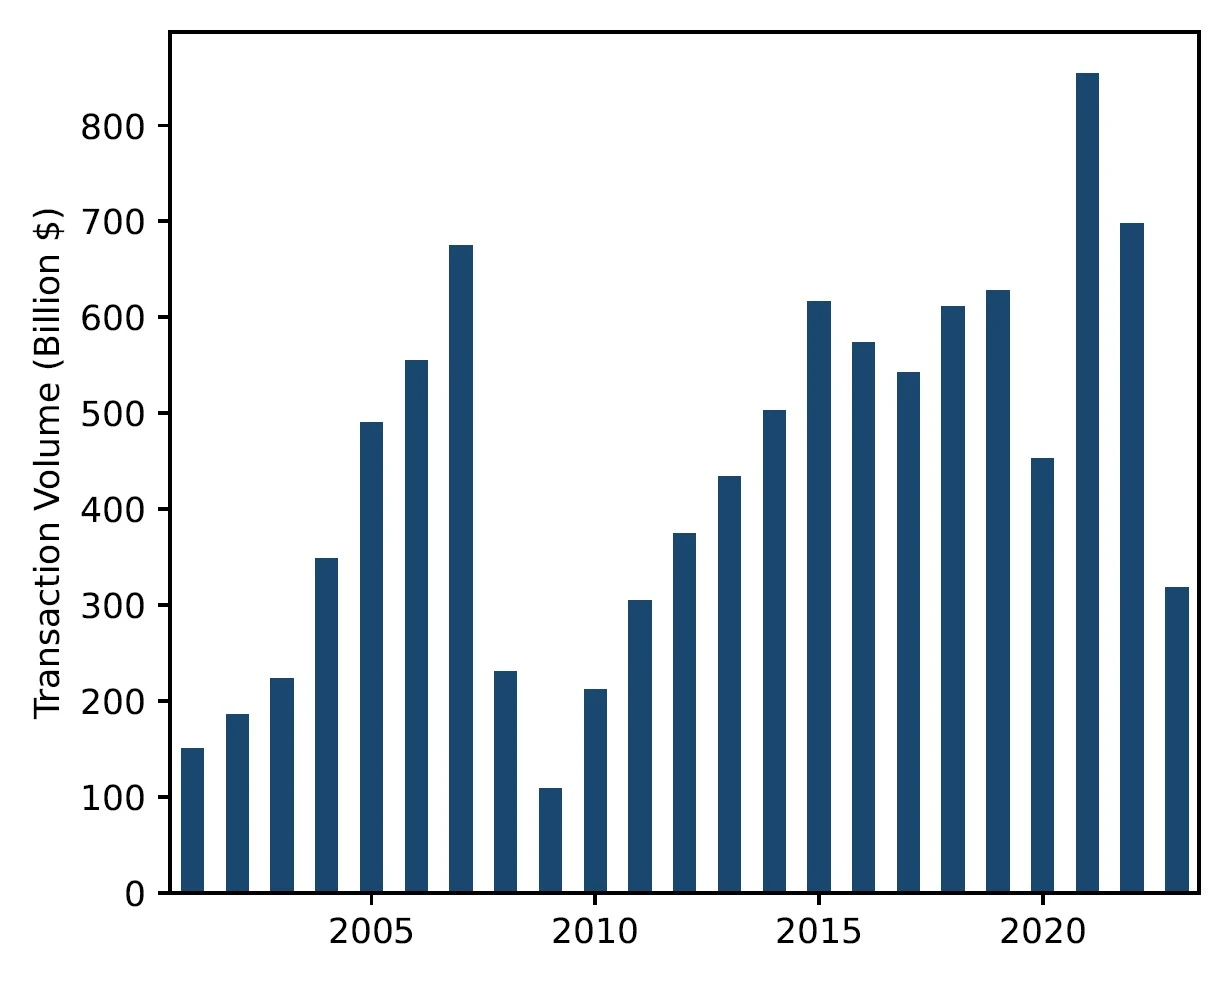
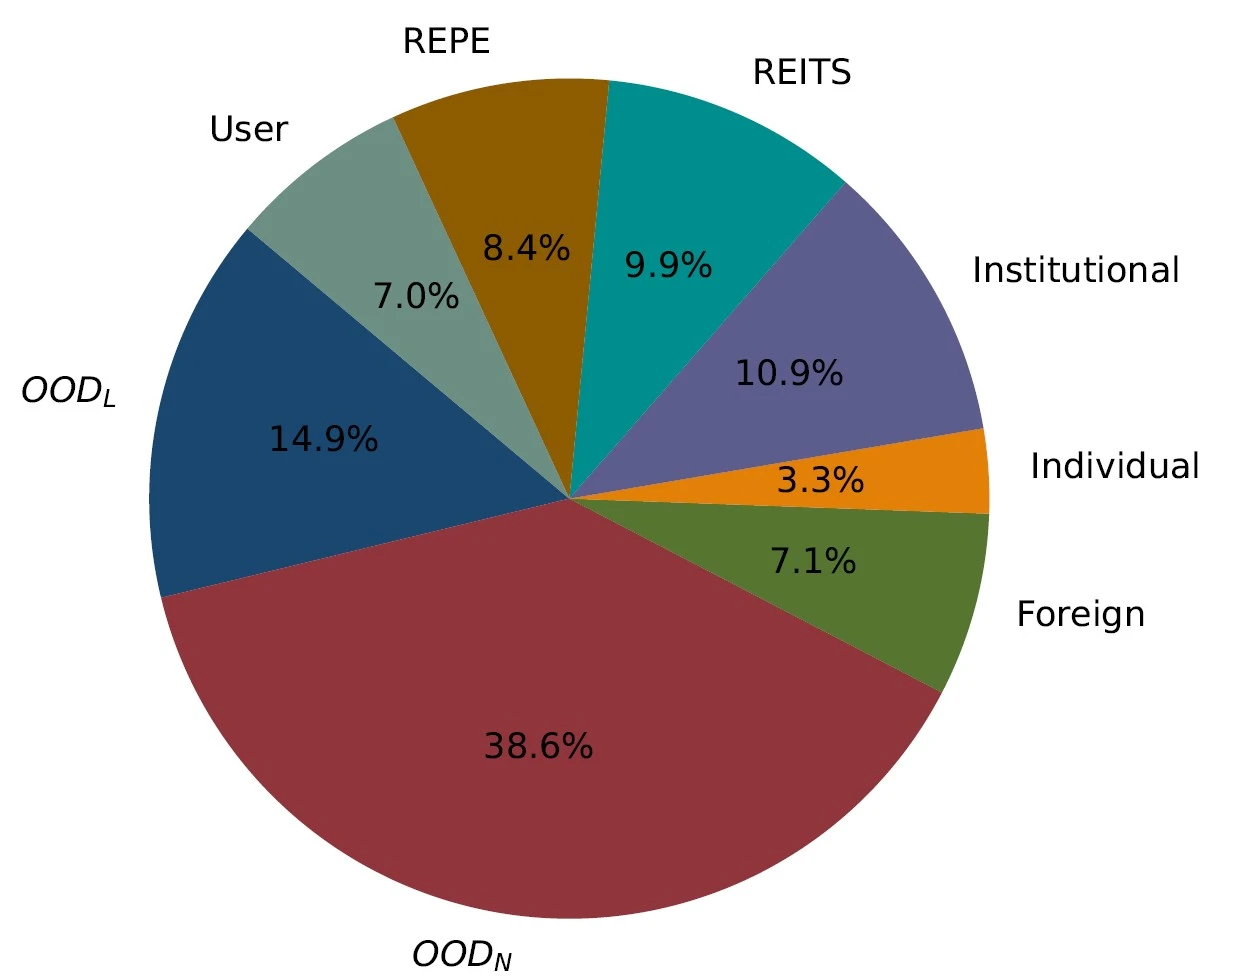
Notes: The first panel shows the total transaction value across all space types (Apartments, Office, Industrial, and Retail), 2001–2023, in billions of constant 2023 U.S. dollars. The second panel shows the composition of aggregate property holdings in 2023 across all space types by investor type. Percentages indicate each group’s share of total holdings.
Our Approach in More Detail
Every deal consists of three steps. First, each investor forms a private view of value for the building. Next, the seller meets a subset of potential buyers. Third, conditional on meeting, the price reflects bargaining between that buyer and that seller. Those steps mirror real deal mechanics: underwriting, marketing, and negotiation.
Each investor’s private valuation consists of two components: a first part explained by observable asset, market, and investor characteristics, and a second residual component capturing liquidity constraints, deal-specific investor views, and other unobservables.
The model starts from standard underwriting inputs: asset size, location, occupancy rate, building age (adjusted for renovation), and deal type (portfolio transaction, distressed transaction). We complement these property-level features with a neighborhood quality proxy and local economic conditions such as income growth, per capita income levels, market-level occupancy rates, and market-level NOI growth rates.
The key difference with a standard hedonic valuation model is that we incorporate investor characteristics directly into valuation: investor type, portfolio scale, geographic and sector concentration, and whether the investor is part of a Joint Venture for the deal.
So, investors do not just value buildings; they value buildings through the lens of their portfolio, strategy, and constraints. These are not just fixed investor attributes, our model allows for interaction effects, so that the same property characteristic can matter differently depending on the investor’s size, specialization, or geography focus. This is precisely what we see in practice: a large institution may avoid small assets, a local developer may discount trophy assets, and a specialist might pay a premium for an asset that fits its strategy particularly well.
Allowing investor traits to shape valuation substantially improves the model’s explanatory power. Adding investor characteristics to a rich hedonic model allows our model to explain well over 80% of the variation in observed transaction prices across space types, double what a traditional linear hedonic valuation model can explain.
Valuations alone do not determine transaction prices, because private-market competition is not anonymous. A seller does not face the entire universe of capital; they face the subset of buyers who hear about the deal, have the mandate and capacity to pursue it, and choose to engage within the timeline. That selection process, driven by brokers, relationships, strategy fit, and execution bandwidth, is central to CRE pricing and liquidity.
To reflect these realities, we model the probability that each potential buyer meets a given asset offered for sale. This probability rises when the deal fits the buyer’s typical transaction size, aligns with the buyer’s existing sector and geographic footprint, and when the two sides have a prior trading relationship. This model, therefore, formalizes what practitioners already know: the same asset can face very different competitive dynamics depending on which buyer segments it reaches. Empirically, incorporating this directed “who shows up” channel improves fit and gives more realistic estimates of both price dispersion and the probability of trade than traditional approaches that assume buyers arrive randomly.
Estimating the transaction model is technically challenging because we need, in principle, to evaluate every potential buyer’s valuation for every asset for sale in every period. We crack this nut by leveraging insights from the way large language models like GPT are estimated which face similar combinatorial complexities.
Once we have estimated the valuation and meeting models, we can replay a realistic sale process in the data. For a given building, the model draws a set of potential buyers according to their meeting probabilities, computes buyer and seller valuations, and allows the transaction when there are gains from trade. When a deal clears, the transaction price is set to the midpoint between the buyer’s and seller’s private valuations.
Running this simulation multiple times produces a “Potential Price Distribution,” rather than a single point estimate. This distribution results in a new CRE liquidity measure, the probability that the asset trades, and a price-risk measure, how dispersed prices can be conditional on a trade. Because the exercise does not condition on the subset of assets that happened to transact or on the particular buyer who actually transacted, it corrects for the selection bias in observed comps.
Validating the framework: foreign buyers in Manhattan office
We apply our framework to study the role of foreign demand for high-quality Manhattan office buildings. Using our estimated valuation and transaction models, we run a thought experiment that practitioners often entertain: what would deal execution have looked like if one important buyer segment had not been in the market? We remove foreign buyers from the pool of potential buyers, and recompute the potential price distribution for top-quartile Manhattan office properties.
Without foreign buyers, we find that transaction prices for top-quartile Manhattan office buildings would have been 5.5% lower and the probability of trade would have been 4.8% lower. Beyond the direct effects on the price and the likelihood of trade, the framework can also quantify where activity shifts when that demand is removed. Many buyers, displaced by foreigners buying up trophy Manhattan offices, continue to transact in the Manhattan office market but shift down to smaller-size properties. Others shift to Manhattan retail and multifamily assets. Yet others shift to different geographies–typically other prime coastal markets. Thus, we quantify the cross-sector and cross-location spillovers that practitioners routinely discuss.
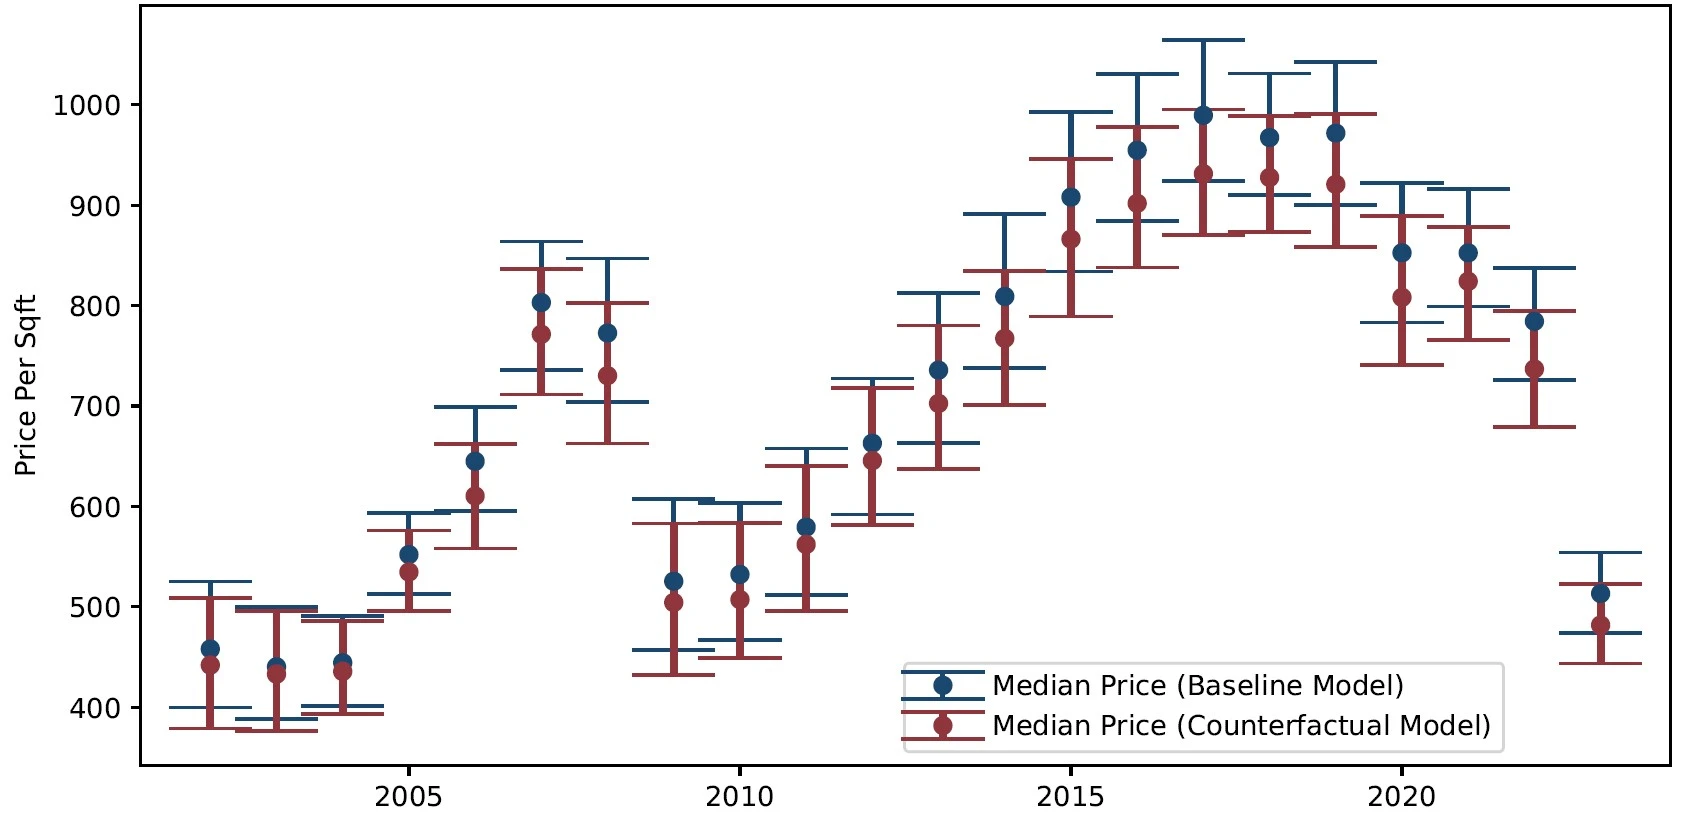
Notes: This figure presents the potential price distribution for top-quartile Manhattan office properties under the baseline model (blue) and a counterfactual model without foreign investors (red) for each year from 2001 to 2023. For each year, the upper (lower) line segment denotes the 75th (25th) percentile of the potential price distribution, and the dot marks the median. All prices are expressed in constant 2023 U.S. dollars
Application to flight-to-quality in the office market as a buyer composition phenomenon
“Flight to quality” is usually framed as tenant-driven, but it can also be understood through buyer composition. In the same market, Class A and Class B office may face the same macro environment, but trade very differently because the buyer pools are different. Top-tier assets continue to attract capital with mandates and balance sheets that can tolerate longer holds, whereas lower-tier assets increasingly rely on local or more opportunistic buyers who underwrite hands-on repositioning and are more sensitive to financing and execution risk.
The CRE Ecosystem framework can formalize that intuition. On the valuation side, the same quality signal captured by rent levels or a neighborhood-quality proxy can translate into different willingness-to-pay across investor types: “quality-mandate” capital systematically pays for it, while other buyers discount it since they cannot monetize it within their strategy. On the meeting side, the framework captures why trophy assets can remain liquid even when the mid-tier freezes: the set of buyers who reliably engage for Class A is typically broader and more stable, while Class B draws a thinner and more episodic buyer set.
In a counterfactual exercise, the framework can be used to ask how out-comes might change if quality-mandate capital steps back: would Class A prices fall disproportionately, would price dispersion widen, and where would displaced demand rotate–into apartments, smaller office deals, or other sectors in the same city? Framed this way, “flight to quality” becomes not just a narrative about tenants, but a quantifiable shift in who investor capital and how it currently views CRE risk.
About the Contributors:
 Stijn Van Nieuwerburgh is the Earle W. Kazis and Benjamin Schore Professor of Real Estate and Professor of Finance at Columbia University’s Graduate School of Business, which he joined in July 2018 after 15 years at New York University’s Stern School of Business. He earned his PhD in Economics (2003), MSc in Financial Mathematics (2001), and MA in Economics (2001) from Stanford University, and a B.A. in Economics from the University of Ghent, Belgium (1998).
His research lies in the intersection of real estate, asset pricing, and macroeconomics. He studies the impact of remote work on real estate valuations, affordable housing policies, mortgage market design, the impact of foreign buyers on the housing market, property price dynamics, and mortgage choice. Another recent strand of his research focuses on government debt and fiscal policy. His has published over 50 articles in peer-reviewed journals and his work is frequently covered in the media, including on 60 Minutes, the New York Times, the Wall Street Journal, the Economist, and the Financial Times. Full bio here.

Neel Shah is a Ph.D. candidate in Finance at Columbia Business School specializing in asset pricing and real estate. His main research areas are behavioral finance, financial derivatives, and commercial real estate, with a focus on how market participants process information. He previously worked in quantitative investment strategies at JP Morgan and holds degrees in computer science and economics from BITS Pilani in India.